In this blog, Buildots take DCW through their recent study, which analysed 64 construction projects worldwide to quantify on-site activity, and explore metrics that highlight inefficiencies in construction projects.
Continue reading to find out what the study has revealed around inefficiencies on-site.
The construction industry is always looking to maximise efficiency. As they say, “You can’t improve what you can’t measure”, but new innovations are enabling us to monitor projects in real-time, gathering powerful datasets that can now show us where inefficiencies hide.
Buildots AI technology, automatically analyses images captured on a 360-degree camera, comparing them with the design and schedule to generate accurate, granular data for enhanced progress tracking and project control. In our recent study we analysed data from 64 global construction projects, 82 years of combined construction time – identifying 4 key areas of inefficiencies often overlooked:
- Return Visits
- Area Utilisation
- Sequence Deviations
- Trade Output Inconsistency
So, what did we find?
Return Visits
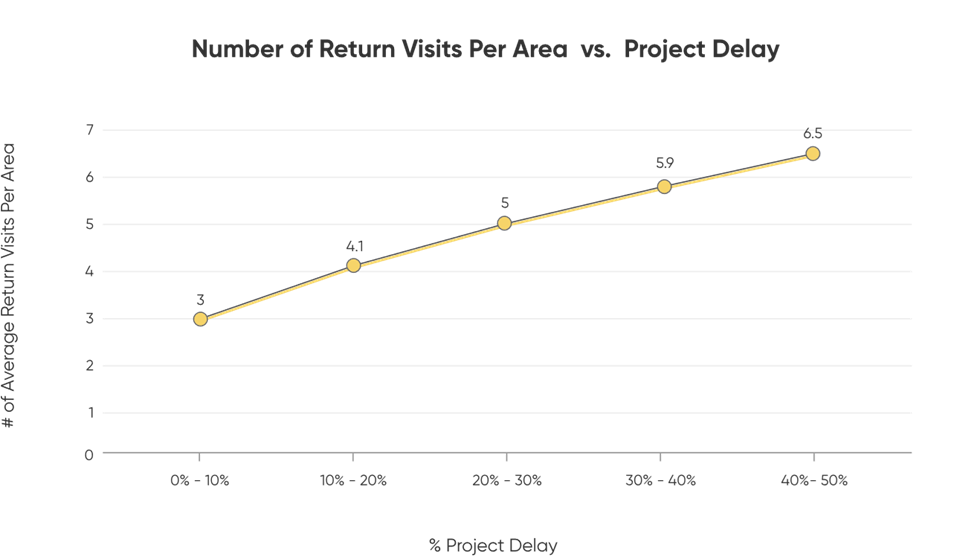
On average, each working area will receive four return visits across trades to complete work that was unfinished on the original visit, meaning that on 10.8% of trade visits, work is left incomplete.
When compared with project delays, we discovered that even projects with less than 10% delays still see an average of three return visits per area.

Return visits occur on all types of projects, regardless of size. This creates an opportunity for managers to increase overall performance by implementing new practices to reduce return visits.
Sequence Deviations
Owing to construction’s complex nature, sequence deviation – activities being completed out of order – is a regular occurrence, having a knock-on effect on following trade activities, with the schedule and planned sequence being adjusted to account for any previous deviations. By identifying how frequently these occur and why, project managers get a clearer picture of how the project progressed.
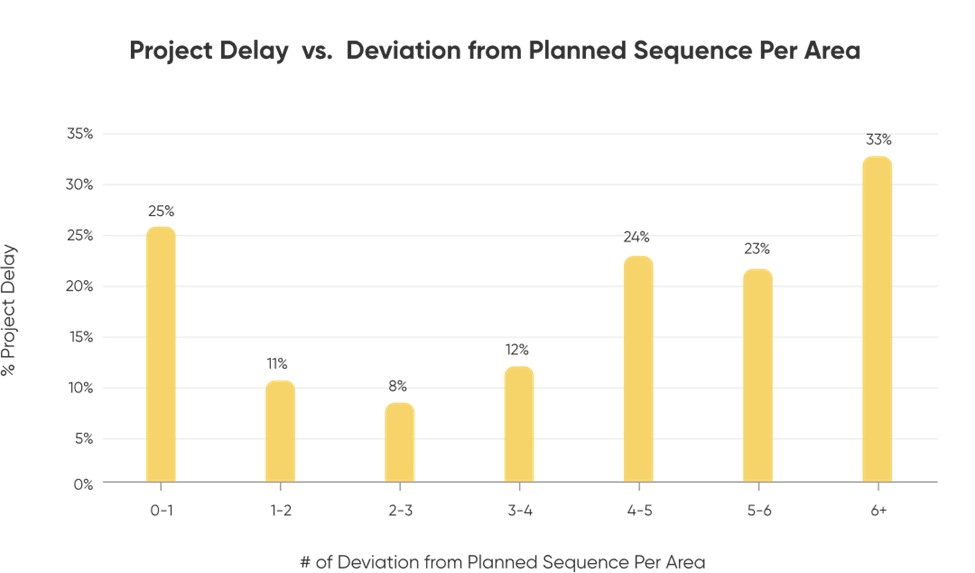
Our research found that, on average, 3.6 activities are started out of sequence in each area. With an average of 37 different activities taking place on each project, 9.7% of activities are therefore performed out of sequence.
A strong correlation exists between the number of deviations and the delay that project experienced. Projects that allowed for only one deviation per area, and those that allowed for more than four, experienced significant delays across the lifetime of the project. Our research exposed a ‘sweet spot’ when it comes to completing activities out of order, which showed that projects experienced the least delays when they had between one and four deviations per area.

Evidently, there is a fine line between following a strict schedule and allowing for flexibility. In order to succeed, projects require the expertise of experienced managers who can use their judgement to find the balance and keep projects on track.
Area Utilisation
It’s not an easy feat to use all available work space on-site. However, being able to maximise your workforce’s output across the largest possible area results in faster turnaround times, increasing efficiency and cost-effectiveness.
Being able to track the available space, and how much is currently sitting idle, can be useful in measuring productivity, and whether your resources are being used to their full potential.
Out of the 14,143,862sq ft of space analysed in our study, we discovered that on average only 46% of areas are utilised on any given project, meaning that more than half of the available space is sitting unused.
When a larger percentage of the available space is being worked on, the project is more likely to meet its weekly completion goal.

This leaves room for a project’s delivery to be shortened by up to 50% with proper planning and resource allocation.
Trade Output Inconsistency
With multiple trades coming and going, and each trade’s work dependent on the preceding trade’s work, fluctuations in output are very common. This, coupled with other factors such as weather conditions and unexpected design changes, creates a highly variable environment for trades to work in.
By measuring the weekly output of each trade, managers can more accurately maintain their project schedules and plan accordingly.
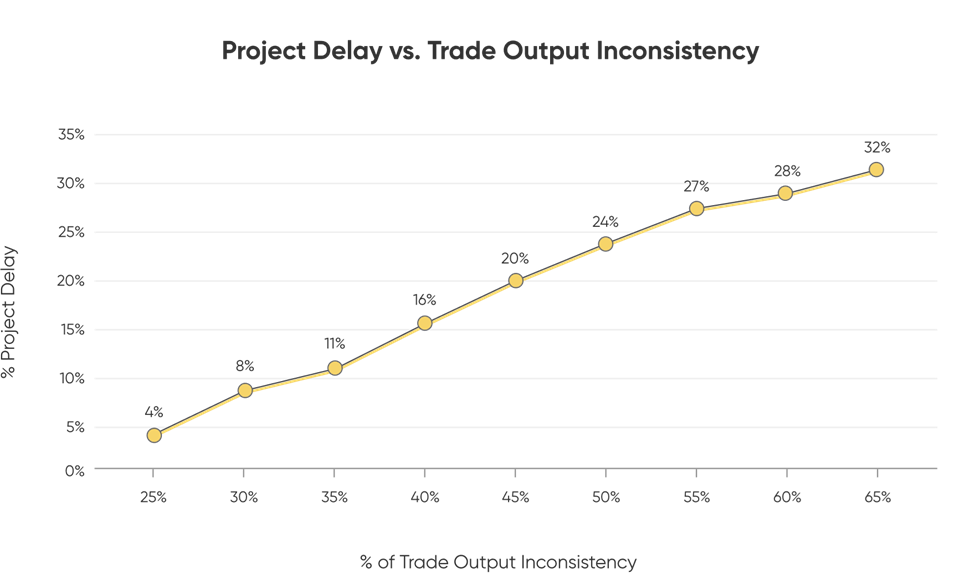
We found that the average output of each trade varied by 56% week-over-week. This is like a trade completing 10,000 sq ft of work one week but only 4,400 sq ft the next. This uncovered a strong correlation between output inconsistency and project delay: the more consistent the output, the closer it gets to its completion deadline.
How does this help you?
You now have data showing that the majority of construction projects suffer from the same issues: return visits, schedule deviations, lack of area utilisation and inconsistent trade output. Our statistics can be used as a benchmark for future projects to measure efficiency. You know what to look out for, and, by using the right tools, you can uncover the reality of what’s happening on-site, helping you effectively allocate resources and keep your project on time, and on budget.
Download a copy of the complete study.
Stop by stand D330 at Digital Construction Week (17-18 May, ExCeL London) to meet the Buildots team.
 By Grace Donnelly